Web scraping: Getting referendum data using Beautiful Soup
In this post I am going to describe how to get the data of the peace referendum (which happened in October the 2nd in Colombia) from the official government website using Beautiful Soup in python (this a task was suggested by Sebastian Martinez). The data is not directly available but is represened as follows:
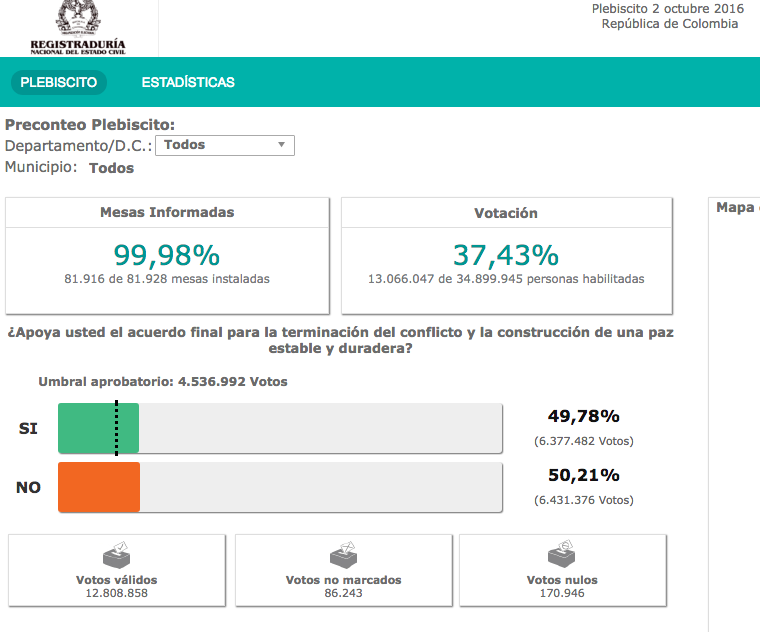
The aim is to get the percentages of votes for each town in Colombia by scraping the website.
Warning: I want to emphasize that this post does not involve analizing the data or getting conclusions from it. These kind of analysis should be done carefully and responsibly.
Step 1: Setting up the enviorment.
# This is the principal website of the referendum.
url_main="http://plebiscito.registraduria.gov.co"
# This is the complete url of the website of the referendum.
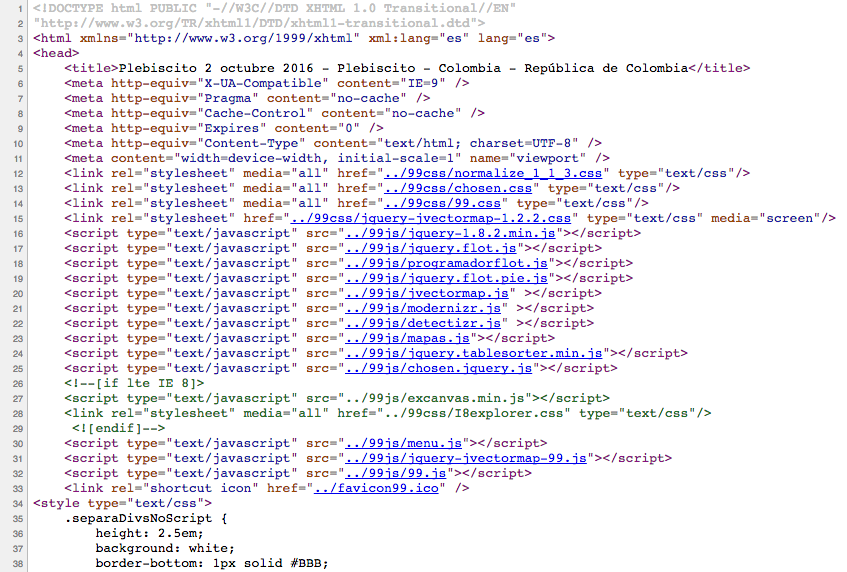
url = "http://plebiscito.registraduria.gov.co/99PL/DPLZZZZZZZZZZZZZZZZZ_L1.htm"The html code of url looks like:
from bs4 import BeautifulSoup
import requests

# This function gets the html of the website.
def get_soup(s):
    r  = requests.get(s)
    data = r.text
    soup = BeautifulSoup(data, "lxml")
    return soup


soup = get_soup(url)
Step 2: Getting the departments (states) information
Here we pick the information of each department as a list. Each element of the list is of type bs4.element.Tag
Remark: You need to explore thr html code to find out that find_all("option")[56:90] actually gets the departments names.
departments_soup = soup.find_all("option")[56:90]We construct from the departments_soup a pandas DataFrame. It contains two columns: 1. The name of the department. 2. The path to each department result page (where detailed infromation is provided).
import pandas as pd

departments = pd.DataFrame(columns=("Department", "path"))

for i in range (0,len(departments_soup)):
    row=pd.Series(dict(zip(["Department", "path"],
                           [departments_soup[i].get_text(),
                            departments_soup[i]["value"]])))
    row.name = i
    departments = departments.append(row)

# Let us see the result.
departments| Department | path | |
|---|---|---|
| 0 | AMAZONAS | ../99PL/DPL60ZZZZZZZZZZZZZZZ_L1.htm |
| 1 | ANTIOQUIA | ../99PL/DPL01ZZZZZZZZZZZZZZZ_L1.htm |
| 2 | ARAUCA | ../99PL/DPL40ZZZZZZZZZZZZZZZ_L1.htm |
| 3 | ATLANTICO | ../99PL/DPL03ZZZZZZZZZZZZZZZ_L1.htm |
| 4 | BOGOTA D.C. | ../99PL/DPL16ZZZZZZZZZZZZZZZ_L1.htm |
| 5 | BOLIVAR | ../99PL/DPL05ZZZZZZZZZZZZZZZ_L1.htm |
| 6 | BOYACA | ../99PL/DPL07ZZZZZZZZZZZZZZZ_L1.htm |
| 7 | CALDAS | ../99PL/DPL09ZZZZZZZZZZZZZZZ_L1.htm |
| 8 | CAQUETA | ../99PL/DPL44ZZZZZZZZZZZZZZZ_L1.htm |
| 9 | CASANARE | ../99PL/DPL46ZZZZZZZZZZZZZZZ_L1.htm |
| 10 | CAUCA | ../99PL/DPL11ZZZZZZZZZZZZZZZ_L1.htm |
| 11 | CESAR | ../99PL/DPL12ZZZZZZZZZZZZZZZ_L1.htm |
| 12 | CHOCO | ../99PL/DPL17ZZZZZZZZZZZZZZZ_L1.htm |
| 13 | CONSULADOS | ../99PL/DPL88ZZZZZZZZZZZZZZZ_L1.htm |
| 14 | CORDOBA | ../99PL/DPL13ZZZZZZZZZZZZZZZ_L1.htm |
| 15 | CUNDINAMARCA | ../99PL/DPL15ZZZZZZZZZZZZZZZ_L1.htm |
| 16 | GUAINIA | ../99PL/DPL50ZZZZZZZZZZZZZZZ_L1.htm |
| 17 | GUAVIARE | ../99PL/DPL54ZZZZZZZZZZZZZZZ_L1.htm |
| 18 | HUILA | ../99PL/DPL19ZZZZZZZZZZZZZZZ_L1.htm |
| 19 | LA GUAJIRA | ../99PL/DPL48ZZZZZZZZZZZZZZZ_L1.htm |
| 20 | MAGDALENA | ../99PL/DPL21ZZZZZZZZZZZZZZZ_L1.htm |
| 21 | META | ../99PL/DPL52ZZZZZZZZZZZZZZZ_L1.htm |
| 22 | NARIÃO | ../99PL/DPL23ZZZZZZZZZZZZZZZ_L1.htm |
| 23 | NORTE DE SAN | ../99PL/DPL25ZZZZZZZZZZZZZZZ_L1.htm |
| 24 | PUTUMAYO | ../99PL/DPL64ZZZZZZZZZZZZZZZ_L1.htm |
| 25 | QUINDIO | ../99PL/DPL26ZZZZZZZZZZZZZZZ_L1.htm |
| 26 | RISARALDA | ../99PL/DPL24ZZZZZZZZZZZZZZZ_L1.htm |
| 27 | SAN ANDRES | ../99PL/DPL56ZZZZZZZZZZZZZZZ_L1.htm |
| 28 | SANTANDER | ../99PL/DPL27ZZZZZZZZZZZZZZZ_L1.htm |
| 29 | SUCRE | ../99PL/DPL28ZZZZZZZZZZZZZZZ_L1.htm |
| 30 | TOLIMA | ../99PL/DPL29ZZZZZZZZZZZZZZZ_L1.htm |
| 31 | VALLE | ../99PL/DPL31ZZZZZZZZZZZZZZZ_L1.htm |
| 32 | VAUPES | ../99PL/DPL68ZZZZZZZZZZZZZZZ_L1.htm |
| 33 | VICHADA | ../99PL/DPL72ZZZZZZZZZZZZZZZ_L1.htm |
Looking into the data we see that there are two deparments (Nariño and Norte de Santander) with misspellings.
departments.loc[22,"Department"] = "NARIÑO"
departments.loc[23,"Department"] = 'NORTE DE SANTANDER'
From each department path we construct the real url and store it in a new column in the deparments DataFrame called “url”.
def construct_complete_url(path):
    complete_url = url_main + path.split("..")[1]
    return complete_url

departments["url"]=departments["path"].apply(lambda x: construct_complete_url(x))
# Let us see the head of the resulting DataFrame.
departments.head()| Department | path | url | |
|---|---|---|---|
| 0 | AMAZONAS | ../99PL/DPL60ZZZZZZZZZZZZZZZ_L1.htm | http://plebiscito.registraduria.gov.co/99PL/DP… |
| 1 | ANTIOQUIA | ../99PL/DPL01ZZZZZZZZZZZZZZZ_L1.htm | http://plebiscito.registraduria.gov.co/99PL/DP… |
| 2 | ARAUCA | ../99PL/DPL40ZZZZZZZZZZZZZZZ_L1.htm | http://plebiscito.registraduria.gov.co/99PL/DP… |
| 3 | ATLANTICO | ../99PL/DPL03ZZZZZZZZZZZZZZZ_L1.htm | http://plebiscito.registraduria.gov.co/99PL/DP… |
| 4 | BOGOTA D.C. | ../99PL/DPL16ZZZZZZZZZZZZZZZ_L1.htm | http://plebiscito.registraduria.gov.co/99PL/DP… |
We create a new column in the deparments DataFrame called soup. This column stores a soup object obtained from their corresponding url.
departments["soup"]=departments["url"].apply(lambda x : get_soup(x))Step 3: Getting the towns information
We make from the departments a pandas DataFrame of towns. It contains three columns: 1. The name of the department. 2. The name of the town. 3. The path to each department result.
towns = pd.DataFrame(columns=("Department", "Town", "path"))

for j in range(0,departments.shape[0]):

    towns_in_department = departments["soup"][j].find_all("option")[36:]

    for i in range (0,len(towns_in_department)):
        dept = departments.loc[j,"Department"]
        town_name = towns_in_department[i].get_text()
        town_path = towns_in_department[i]["value"]
        row = pd.Series(dict(zip(["Department", "Town", "path"],[dept,town_name,town_path])))
        towns = towns.append(row, ignore_index=True)
# Let us see the structure for the first 20 towns.
towns.head(20)| Department | Town | path | |
|---|---|---|---|
| 0 | AMAZONAS | EL ENCANTO | ../99PL/DPL60010ZZZZZZZZZZZZ_L1.htm |
| 1 | AMAZONAS | LA CHORRERA | ../99PL/DPL60013ZZZZZZZZZZZZ_L1.htm |
| 2 | AMAZONAS | LA PEDRERA | ../99PL/DPL60016ZZZZZZZZZZZZ_L1.htm |
| 3 | AMAZONAS | LA VICTORIA | ../99PL/DPL60017ZZZZZZZZZZZZ_L1.htm |
| 4 | AMAZONAS | LETICIA | ../99PL/DPL60001ZZZZZZZZZZZZ_L1.htm |
| 5 | AMAZONAS | MIRITI PARANA | ../99PL/DPL60019ZZZZZZZZZZZZ_L1.htm |
| 6 | AMAZONAS | PUERTO ALEGRIA | ../99PL/DPL60030ZZZZZZZZZZZZ_L1.htm |
| 7 | AMAZONAS | PUERTO ARICA | ../99PL/DPL60040ZZZZZZZZZZZZ_L1.htm |
| 8 | AMAZONAS | PUERTO NARIÃO | ../99PL/DPL60007ZZZZZZZZZZZZ_L1.htm |
| 9 | AMAZONAS | PUERTO SANTANDER | ../99PL/DPL60021ZZZZZZZZZZZZ_L1.htm |
| 10 | AMAZONAS | TARAPACA | ../99PL/DPL60022ZZZZZZZZZZZZ_L1.htm |
| 11 | ANTIOQUIA | ABEJORRAL | ../99PL/DPL01004ZZZZZZZZZZZZ_L1.htm |
| 12 | ANTIOQUIA | ABRIAQUI | ../99PL/DPL01007ZZZZZZZZZZZZ_L1.htm |
| 13 | ANTIOQUIA | ALEJANDRIA | ../99PL/DPL01010ZZZZZZZZZZZZ_L1.htm |
| 14 | ANTIOQUIA | AMAGA | ../99PL/DPL01013ZZZZZZZZZZZZ_L1.htm |
| 15 | ANTIOQUIA | AMALFI | ../99PL/DPL01016ZZZZZZZZZZZZ_L1.htm |
| 16 | ANTIOQUIA | ANDES | ../99PL/DPL01019ZZZZZZZZZZZZ_L1.htm |
| 17 | ANTIOQUIA | ANGELOPOLIS | ../99PL/DPL01022ZZZZZZZZZZZZ_L1.htm |
| 18 | ANTIOQUIA | ANGOSTURA | ../99PL/DPL01025ZZZZZZZZZZZZ_L1.htm |
| 19 | ANTIOQUIA | ANORI | ../99PL/DPL01028ZZZZZZZZZZZZ_L1.htm |
We create a new column in the towns DataFrame called url. This column stores the real url for each town.
towns["url"]=towns["path"].apply(lambda x: construct_complete_url(x))# Let us see the result.
towns.head()| Department | Town | path | url | |
|---|---|---|---|---|
| 0 | AMAZONAS | EL ENCANTO | ../99PL/DPL60010ZZZZZZZZZZZZ_L1.htm | http://plebiscito.registraduria.gov.co/99PL/DP… |
| 1 | AMAZONAS | LA CHORRERA | ../99PL/DPL60013ZZZZZZZZZZZZ_L1.htm | http://plebiscito.registraduria.gov.co/99PL/DP… |
| 2 | AMAZONAS | LA PEDRERA | ../99PL/DPL60016ZZZZZZZZZZZZ_L1.htm | http://plebiscito.registraduria.gov.co/99PL/DP… |
| 3 | AMAZONAS | LA VICTORIA | ../99PL/DPL60017ZZZZZZZZZZZZ_L1.htm | http://plebiscito.registraduria.gov.co/99PL/DP… |
| 4 | AMAZONAS | LETICIA | ../99PL/DPL60001ZZZZZZZZZZZZ_L1.htm | http://plebiscito.registraduria.gov.co/99PL/DP… |
Step 4: Get votes
Now that we have access to each town website results, we are going to get the percentage of yes, no and null votes.
# This function transform the vote string of the function below
# in order to get an integer.

# To understan the logic of this function you need to understand
# the structure of the html code.

def get_vote_int_from_string(vote_string, is_null_votes):

    if(is_null_votes):
        num_v = vote_string.split("Votos nulos")[1]
    else:
        num_v = vote_string.split("(")[1].split( )[0]

    num = "".join(num_v.split("."))
    return int(num)

# This function gets the votation information.
def get_votes(u):
    s=get_soup(u)

    yes = s.find_all("div", class_="skill-bar-percent")[1].get_text()
    no = s.find_all("div", class_="skill-bar-percent")[3].get_text()
    null = s.find_all("div", class_="cajaInfTercera")[0].find_all("div", class_="contenido")[0].get_text()

    votes = (get_vote_int_from_string(yes, False),
             get_vote_int_from_string(no, False),
             get_vote_int_from_string(null, True))

    return votes
We create a new column in the towns DataFrame called votes which stores the information in a tuple.
towns["votes"]=towns["url"].apply(lambda x : get_votes(x))towns.head()| Department | Town | path | url | votes | |
|---|---|---|---|---|---|
| 0 | AMAZONAS | EL ENCANTO | ../99PL/DPL60010ZZZZZZZZZZZZ_L1.htm | http://plebiscito.registraduria.gov.co/99PL/DP… | (170, 51, 2) |
| 1 | AMAZONAS | LA CHORRERA | ../99PL/DPL60013ZZZZZZZZZZZZ_L1.htm | http://plebiscito.registraduria.gov.co/99PL/DP… | (300, 62, 3) |
| 2 | AMAZONAS | LA PEDRERA | ../99PL/DPL60016ZZZZZZZZZZZZ_L1.htm | http://plebiscito.registraduria.gov.co/99PL/DP… | (189, 25, 1) |
| 3 | AMAZONAS | LA VICTORIA | ../99PL/DPL60017ZZZZZZZZZZZZ_L1.htm | http://plebiscito.registraduria.gov.co/99PL/DP… | (4, 1, 0) |
| 4 | AMAZONAS | LETICIA | ../99PL/DPL60001ZZZZZZZZZZZZ_L1.htm | http://plebiscito.registraduria.gov.co/99PL/DP… | (4403, 4463, 84) |
Next we get the yes, no and null votes separately. We also compute the total of votes.
# We get YES.
towns["YES"] = towns["votes"].apply(lambda x : x[0])

# We get NO.
towns["NO"] = towns["votes"].apply(lambda x : x[1])

# We get NULL.
towns["NULL"] = towns["votes"].apply(lambda x : x[2])

# We comute the total (sum).
towns["TOTAL"] = towns["votes"].apply(lambda x : sum(x))
# Let us see the final strcuture.
towns.head()| Department | Town | path | url | votes | YES | NO | NULL | TOTAL | |
|---|---|---|---|---|---|---|---|---|---|
| 0 | AMAZONAS | EL ENCANTO | ../99PL/DPL60010ZZZZZZZZZZZZ_L1.htm | http://plebiscito.registraduria.gov.co/99PL/DP… | (170, 51, 2) | 170 | 51 | 2 | 223 |
| 1 | AMAZONAS | LA CHORRERA | ../99PL/DPL60013ZZZZZZZZZZZZ_L1.htm | http://plebiscito.registraduria.gov.co/99PL/DP… | (300, 62, 3) | 300 | 62 | 3 | 365 |
| 2 | AMAZONAS | LA PEDRERA | ../99PL/DPL60016ZZZZZZZZZZZZ_L1.htm | http://plebiscito.registraduria.gov.co/99PL/DP… | (189, 25, 1) | 189 | 25 | 1 | 215 |
| 3 | AMAZONAS | LA VICTORIA | ../99PL/DPL60017ZZZZZZZZZZZZ_L1.htm | http://plebiscito.registraduria.gov.co/99PL/DP… | (4, 1, 0) | 4 | 1 | 0 | 5 |
| 4 | AMAZONAS | LETICIA | ../99PL/DPL60001ZZZZZZZZZZZZ_L1.htm | http://plebiscito.registraduria.gov.co/99PL/DP… | (4403, 4463, 84) | 4403 | 4463 | 84 | 8950 |
Step 5: Export the data into a csv file
We export the towns DataFrame into a .csv file with all the data.
columns_to_print = ["Department", "Town", "YES", "NO", "NULL", "TOTAL"]

towns[columns_to_print].to_csv("resultados.csv", index=False)
Step 6: Data Exploration
Let us see how to begin a simple exploration of the data.
data = pd.read_csv("resultados.csv", index_col="Department")

data.head()| Town | YES | NO | NULL | TOTAL | |
|---|---|---|---|---|---|
| Department | |||||
| AMAZONAS | EL ENCANTO | 170 | 51 | 2 | 223 |
| AMAZONAS | LA CHORRERA | 300 | 62 | 3 | 365 |
| AMAZONAS | LA PEDRERA | 189 | 25 | 1 | 215 |
| AMAZONAS | LA VICTORIA | 4 | 1 | 0 | 5 |
| AMAZONAS | LETICIA | 4403 | 4463 | 84 | 8950 |
In order to get information from each department we group the results by adding the total votes for each category.
results_departments = data.groupby(data.index).sum()Now we compute basic ratios of the results.
results_departments["YES/TOTAL"] = results_departments["YES"]/results_departments["TOTAL"]
results_departments["NO/TOTAL"] = results_departments["NO"]/results_departments["TOTAL"]

results_departments.head()| YES | NO | NULL | TOTAL | YES/TOTAL | NO/TOTAL | |
|---|---|---|---|---|---|---|
| Department | ||||||
| AMAZONAS | 6524 | 4994 | 114 | 11632 | 0.560867 | 0.429333 |
| ANTIOQUIA | 648051 | 1057518 | 22416 | 1727985 | 0.375033 | 0.611995 |
| ARAUCA | 28653 | 30274 | 1523 | 60450 | 0.473995 | 0.500811 |
| ATLANTICO | 258121 | 168300 | 2132 | 428553 | 0.602308 | 0.392717 |
| BOGOTA D.C. | 1423612 | 1114933 | 25213 | 2563758 | 0.555283 | 0.434882 |
Visualization
Here we plot the YES/TOTAL ratio for all the departments.
import matplotlib as plt
import seaborn as sns
%matplotlib inline

results_departments.plot(y="YES/TOTAL",
                         kind='bar',
                         stacked=True,
                         title="YES/TOTAL per Department",
                         ylim=(0,1.0),
                         figsize=(12,12))
plt.pyplot.xticks(rotation=90)
(array([ 0, 1, 2, 3, 4, 5, 6, 7, 8, 9, 10, 11, 12, 13, 14, 15, 16,
17, 18, 19, 20, 21, 22, 23, 24, 25, 26, 27, 28, 29, 30, 31, 32, 33]),
<a list of 34 Text xticklabel objects>)
Here we plot the TOTAL votation for all the departments.
results_departments.plot(y="TOTAL",
                         kind='bar',
                         title="Total Votes per Department",
                         figsize=(12,12))
plt.pyplot.xticks(rotation=90)
(array([ 0, 1, 2, 3, 4, 5, 6, 7, 8, 9, 10, 11, 12, 13, 14, 15, 16,
17, 18, 19, 20, 21, 22, 23, 24, 25, 26, 27, 28, 29, 30, 31, 32, 33]),
<a list of 34 Text xticklabel objects>)
Now we want to get information within each department.
results_towns = data.copy()

results_towns["YES/TOTAL"]=results_towns["YES"]/results_towns["TOTAL"]
results_towns["NO/TOTAL"]=results_towns["NO"]/results_towns["TOTAL"]

results_towns.head()| Town | YES | NO | NULL | TOTAL | YES/TOTAL | NO/TOTAL | |
|---|---|---|---|---|---|---|---|
| Department | |||||||
| AMAZONAS | EL ENCANTO | 170 | 51 | 2 | 223 | 0.762332 | 0.228700 |
| AMAZONAS | LA CHORRERA | 300 | 62 | 3 | 365 | 0.821918 | 0.169863 |
| AMAZONAS | LA PEDRERA | 189 | 25 | 1 | 215 | 0.879070 | 0.116279 |
| AMAZONAS | LA VICTORIA | 4 | 1 | 0 | 5 | 0.800000 | 0.200000 |
| AMAZONAS | LETICIA | 4403 | 4463 | 84 | 8950 | 0.491955 | 0.498659 |
Here we plot the YES/TOTAL ratio for the deparment CHOCO.
results_towns[results_towns.index=="CHOCO"].plot(x="Town", y="YES/TOTAL",
                                                  kind='bar',
                                                  title="YES/TOTAL for CHOCO",
                                                  figsize=(12,12),
                                                  ylim=(0,1.0))
Here we plot the YES/TOTAL ratio for the deparment CHOCO.
results_towns[results_towns.index=="CALDAS"].plot(x="Town", y="YES/TOTAL",
                                                  kind='bar',
                                                  title="YES/TOTAL for CALDAS",
                                                  figsize=(12,12),
                                                  ylim=(0,1.0))
As mentioned in the introduction, now that the data is available it is necessary to make a detailed and structured study of these results. For example, mapping these results to education level, precense of the guerrilla, etc. Of course, this is something which, for now, is beyond the scope of this post.