This post is motivated by the tweet:
Friday afternoon challenge. Simulate the spread of a disease among 100 people beginning with 1 infected individual
— Teddy Petrou (@TedPetrou) April 24, 2020
Place people as points in a square grid with random starting points randomly moving in one direction
Transmission of disease proportional to distance from infected pic.twitter.com/smWXpR6ZIC
This was a perfect excuse to explore animations with Matplotlib.
Warning: This notebook does not aim to explain/predict anything related with covid19 (I leave that to the experts!). Please take this as a programming/data-viz exercise.
Prepare Notebook
import numpy as np
import pandas as pd

import matplotlib.pyplot as plt
import seaborn as sns
plt.style.use(['dark_background'])
sns_c = sns.color_palette(palette='deep')
%matplotlib inline

from pandas.plotting import register_matplotlib_converters
register_matplotlib_converters()

from matplotlib.animation import FuncAnimation
from IPython.display import HTML

# Set global plot parameters.
plt.rcParams['figure.figsize'] = [8, 8]
plt.rcParams['figure.dpi'] = 80
Model Definition
We define a class Body to represent each individual.
- Each body has a potion (x, y coordinates) inside a box of size \(L>0\) (when it hits a boundary it rebounds).
- A body can move randomly (normal steps) within the box. We record each position after a movement.
- A body has a health status: sick or not sick.
- We assume that, if the body is sick, then it can infect other bodies with a probability (via Bernoulli distribution) \(\exp(-d/\tau)\), where \(d\) is the distance between two bodies and \(\tau\) is a characteristic infection distance parameter.
- We record the health history on demand (not after every interaction).
L = 100

class Body():

    def __init__(self, x0, y0, box_size=L, sigma=0.02, inf_dist=2):
        self.box_size = box_size
        self.x = x0
        self.y = y0
        self.sigma = sigma
        self.loc_history = [(x0, y0)]
        self.is_sick = False
        self.health_history = [False]
        self.inf_dist = inf_dist

    def add_to_loc_history(self, x, y):
        self.loc_history.append((x, y))

    def add_to_health_history(self, x):
        self.health_history.append(x)

    def get_infected(self):
        self.is_sick = True

    @staticmethod
    def new_position(z, dz, box_size):
        zhat = abs(z + dz)

        if(zhat > box_size):
            zhat = 2*box_size - zhat
        return zhat

    def move(self):
        sigma = self.sigma * self.box_size
        dx = np.random.normal(loc=0.0, scale=sigma)
        dy = np.random.normal(loc=0.0, scale=sigma)

        self.x = Body.new_position(z=self.x, dz=dx, box_size=self.box_size)
        self.y = Body.new_position(z=self.y, dz=dy, box_size=self.box_size)
        self.add_to_loc_history(self.x, self.y)

    def distance(self, other):
        return np.sqrt((self.x - other.x)**2 + (self.y - other.y)**2)

    def interact(self, other):
        dist = self.distance(other)
        status = self.is_sick + other.is_sick

        if ((status % 2) != 0):

            if (self.is_sick):
                prob = np.exp(-dist/self.inf_dist)
                change_status = np.random.binomial(n=1, p=prob)
                if (change_status):
                    other.get_infected()
            else:
                prob = np.exp(-dist/other.inf_dist)
                change_status = np.random.binomial(n=1, p=prob)
                if (change_status):
                    self.get_infected()
Let us see an example:
b1 = Body(0, 0)
b2 = Body(0.1, 0)
print('B1 is sick: ' + str(b1.is_sick))
print('B2 is sick: ' + str(b2.is_sick))
B1 is sick: False
B2 is sick: Falseb2.get_infected()
b1.interact(b2)
print('B1 is sick: ' + str(b1.is_sick))
print('B2 is sick: ' + str(b2.is_sick))B1 is sick: True
B2 is sick: TrueNext let us define the Simulation class. This just makes a set of bodies interact in a box. The simulation starts wt just one sick body.
class Simulation():

    def __init__(self, n_bodies, num, box_size=L, inf_dist=2):
        self.box_size = box_size
        self.n_bodies = n_bodies
        self.num = num
        self.bodies = [
            Body(
                x0=np.random.uniform(low=0.0, high=self.box_size),
                y0=np.random.uniform(low=0.0, high=self.box_size),
                box_size=self.box_size,
                inf_dist=inf_dist
            )
            for i in range(0, self.n_bodies)
        ]
        self.hist_len = 1

    def run(self):
        self.bodies[0].get_infected()
        for i in range(self.num):
            for j, b1 in enumerate(self.bodies):
                for k, b2 in enumerate(self.bodies):
                    if (j < k):
                        b1.interact(b2)
            [b.add_to_health_history(b.is_sick) for b in self.bodies]
            [b.move() for b in self.bodies]
        self.hist_len = self.hist_len + self.num

    def animate(self):
        fig, ax = plt.subplots()
        ax.set(title='Animation', xlim=(0, self.box_size), ylim=(0, self.box_size))
        scat = ax.scatter(x=[], y=[], c='black', linewidths=4)

        def update(i):
            x = [b.loc_history[i][0] for b in self.bodies]
            y = [b.loc_history[i][1] for b in self.bodies]
            x = np.array(x).reshape(-1, 1)
            y = np.array(y).reshape(-1, 1)
            scat.set_offsets(np.concatenate((x, y), axis=1))
            scat.set_edgecolors(np.array([sns_c[3] if b.health_history[i] else sns_c[2] for b in self.bodies]))
            return scat,

        anim = FuncAnimation(fig, update, frames=self.hist_len, interval=200, blit=True)
        return anim
Results
First, let us plot a movement of one single body:
sim_1 = Simulation(n_bodies=1, num=500)
sim_1.run()

body_history_df = pd.DataFrame(sim_1.bodies[0].loc_history, columns=['x', 'y']).reset_index()

fig, ax = plt.subplots()
sns.scatterplot(x='x', y='y', hue='index', palette='cool', edgecolor='black', data=body_history_df, ax=ax)
ax.legend(loc='center left', bbox_to_anchor=(1, 0.5))
ax.set(title=f'One Body Movement - {sim_1.num} Steps', xlim=(0.0, L), ylim=(0.0, L))
plt.savefig('one_body.png', dpi=200, bbox_inches='tight');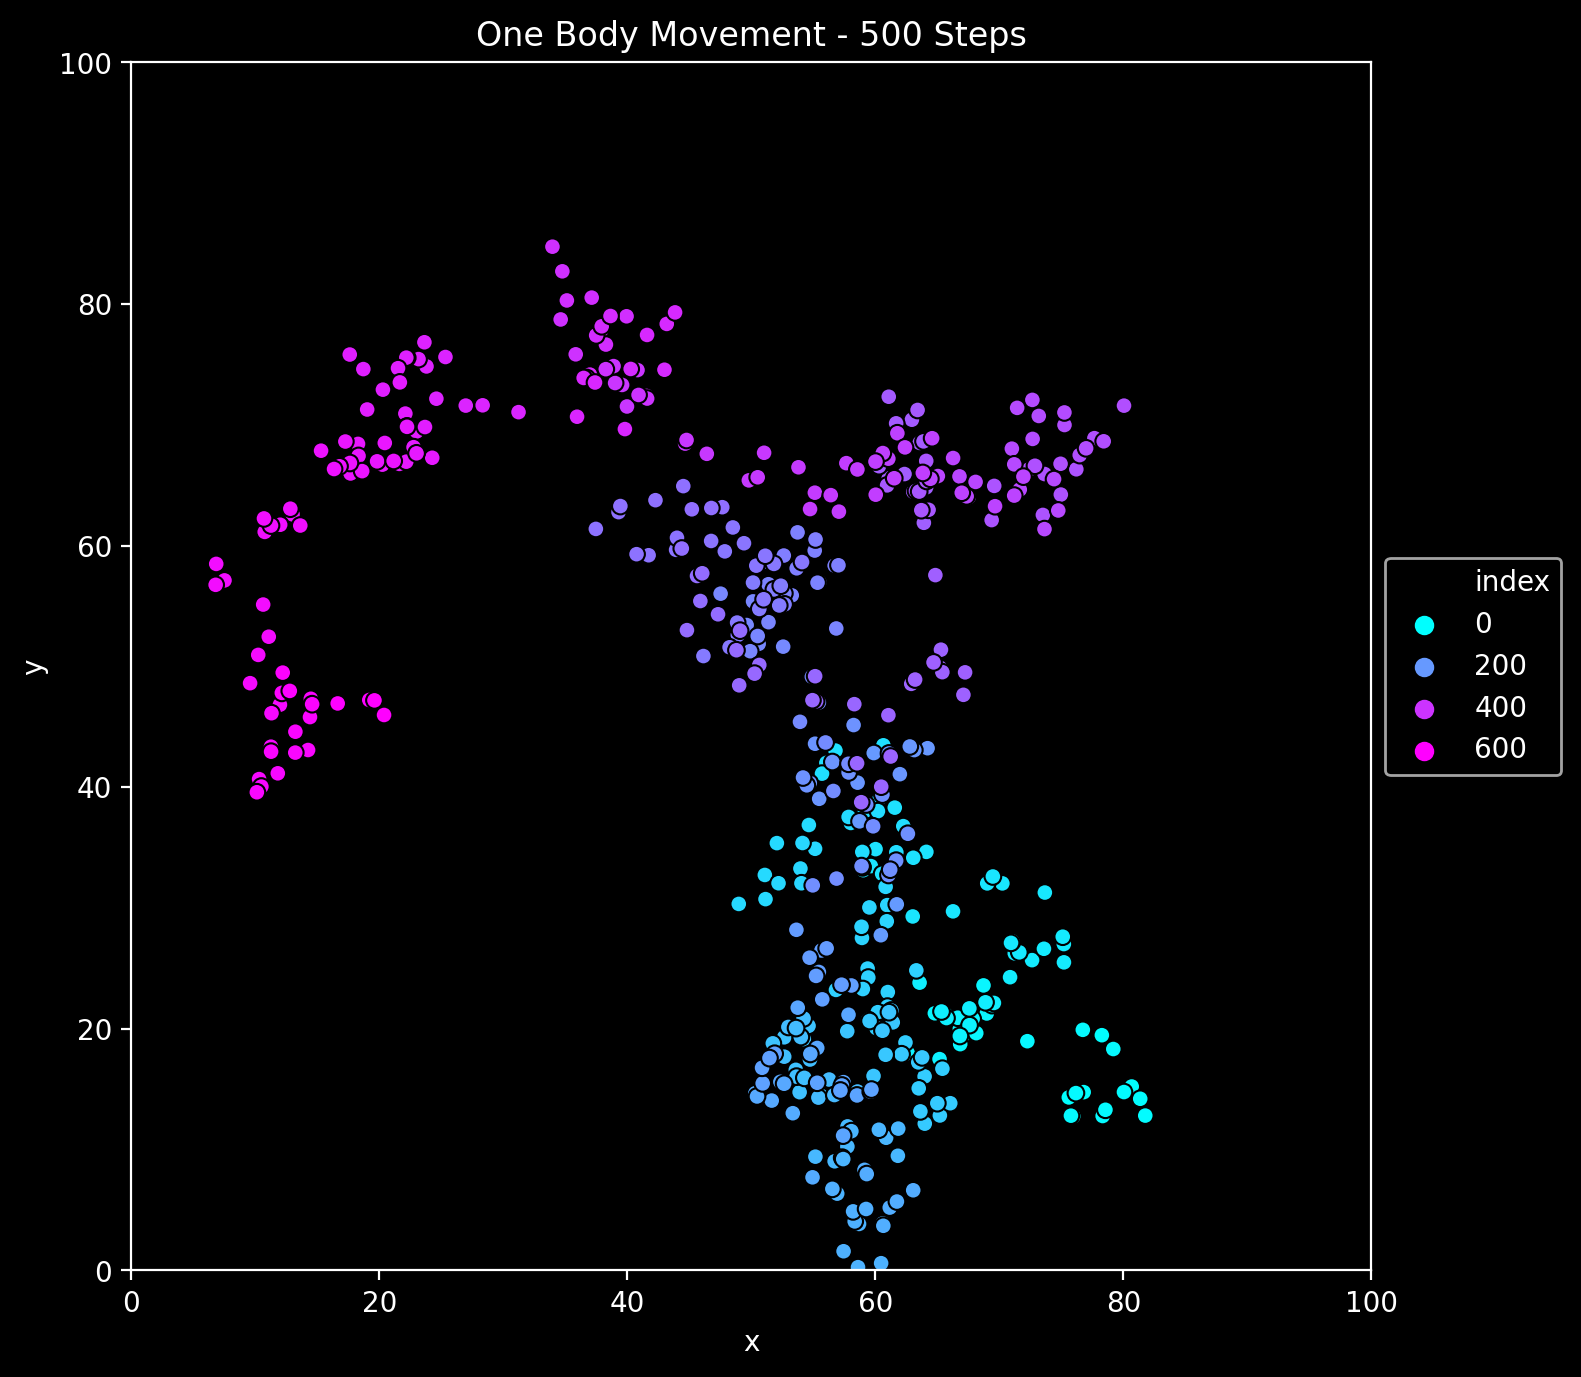
Next, let us generate an animation for n_bodies = 200 and num=100 (iterations).
sim = Simulation(n_bodies=200, num=100)
sim.run()

anim = sim.animate()
HTML(anim.to_jshtml())
anim.save('animation.gif', writer='imagemagick', fps=10)
Finally, let us decrease the characteristic infection distance parameter to inf_dist=0.5. We indeed see the infection speed decreases.
sim2 = Simulation(n_bodies=200, num=100, inf_dist=0.5)
sim2.run()

anim2 = sim2.animate()
HTML(anim2.to_jshtml())
anim2.save('animation2.gif', writer='imagemagick', fps=10)
Remark: Animation with Matplotlib
This use case was a perfect setting to explore the animation module of Matplotlib.
I believe it is very powerful, but non-trivial to start with. I found this stackoverflow thread very useful.
I was not able to do a simple task: color the points based on the health status via
scat.set_array(...). I had to color the edges of the points (if you manage to do it please let me know).It would be great to generate animations using seaborn.
To save the animation as a gift you can run
# !brew install imagemagickon a Jupyter cell.